Building a simple golf swing system is the focus of this second installment in the Student's Guide on How to Translate Information into Progress.
But what exactly does "system" mean? Those with an engineering background will recognize a system as "A set of interacting and interdependent entities forming an integrated whole."
Want to feel this in YOUR swing? Try a free AI-powered golf lesson → — GOATY gives you real-time voice coaching, pose tracking, and instant feedback on every rep.
Related: How to add swing speed with AI-detected gate coaching →
Android users: Download GOATY on Google Play — free AI golf coaching on your Android phone. →
Put simply, every part of a system both influences and relies upon the other parts — nothing operates in isolation.
Stop reading about it — feel it in your swing today
GOATY watches your swing live and coaches you between every rep. Free. No signup.
Start Your FREE Live Lesson →
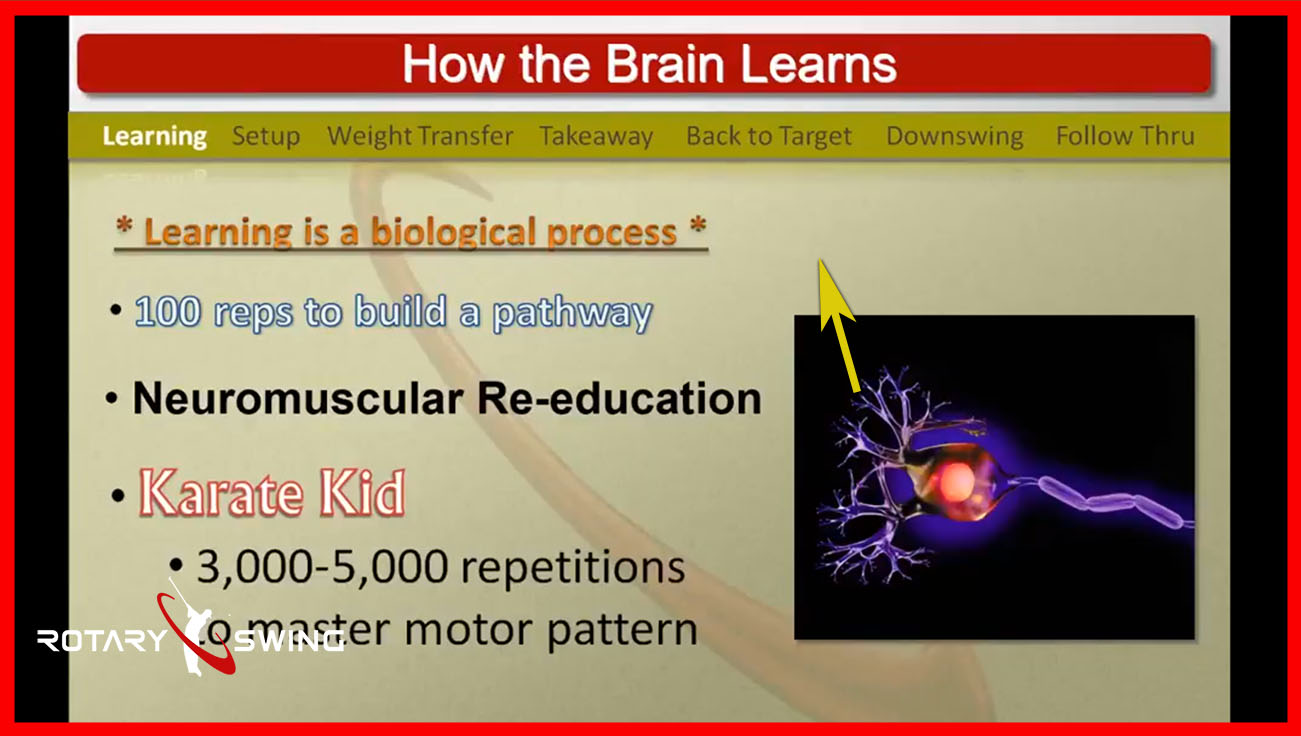
The five elements of the golf swing are interdependent. They form a simple golf swing system.
This principle holds true in the golf swing as well: the quality of each phase depends entirely on the quality of what precedes it.
If your setup is compromised, the cascading effect means your follow through is unlikely to produce the ball flight you want.

The learning hierarchy
RST is built on a structured Learning System — you've all seen the hierarchy of learning. Nothing we cover today contradicts or replaces any of that foundational framework.
Instead, what we're going to explore today is a practical approach to monitoring progress and performance in your golf swing development.
Depending on what aspect of your game you're working on and what specific goals you've set, there are different methods to evaluate and track your improvement over time.
What About the Handicap System?
Some golfers will argue that the sport already has a built-in evaluation system — the handicap.
A handicap is certainly one form of evaluation and tracking, but it's a deeply flawed metric for the RST student because all it measures is your ability to get the ball in the hole.
A handicap number can be misleading in many ways.
A mediocre ball striker who excels at putting and chipping may carry an 8 or 9 handicap, while someone who strikes the ball powerfully and accurately but struggles on the greens may sit at 10 or 11.
The system we're going to discuss today deals strictly with the golf swing itself — isolating your swing mechanics from the other variables that influence scoring.
Let's Take an Example

Engine cooling is an example of a system.
To illustrate how systems thinking applies, let's start with a familiar example. The engine cooling system in a car is something most of us understand at a basic level.
The purpose of this system is straightforward: carry waste heat away from the engine to prevent overheating.
As a vehicle owner, you probably don't think much about the cooling system until a mechanic mentions it or that red warning light appears on your dashboard.
An engineer, however, would view this system through a more analytical lens. An engineer would break it down into five distinct components:
- Hoses and Seals
- Pump
- Thermostat
- Radiator
- Fan
Hoses and seals contain the coolant within the system. The pump circulates the fluid. The thermostat is a small component with an outsized impact on the entire system.
If the thermostat were to fail in the closed position, it would trap coolant in the engine block, causing the engine to overheat. Then there's the radiator itself and the fan.
Older vehicles used belt-driven fans that ran continuously off the engine.

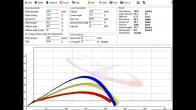
Basic control chart (above), broken down into categories (center), applied (below)
Modern vehicles use electronically controlled fans that activate based on temperature changes, making them less critical in cooler climates than in warmer weather.
Charting the System
This is a straightforward system with just five components — yet each one is vital to the whole.
An engineer would use a control chart to monitor how well the system performs over time.
Anyone who has studied statistics or quality control will recognize this type of visualization.
The top image shows the basic structure of a 2-sigma — two standard deviation — control chart.
Engineers then transform that chart into a color-coded visual indicator to provide an immediate read on how the system is performing, and they break it down further to evaluate each individual component.
You can see in the middle image at right how the chart is divided into columns, one for each component.
This is a fairly simple system. If we grade it using the control chart, we might determine that the hoses and seals are holding fluid properly — green. The pump is functioning well — green. The thermostat is operating correctly — green.
The lower image at right shows those first three columns in green because our first three system components are performing well.
Perhaps the car has a couple hundred thousand miles on it and some mineral scale has accumulated on the radiator, reducing its efficiency slightly — that drops it down into the white (Functional) space.
Now imagine the electronics on the fan have failed. Perhaps it's winter and you don't even notice. Then the first warm day of spring arrives, you're stuck in traffic, and you discover the problem the hard way.
That component drops into yellow space — an area where issues need to be addressed before they become critical.
What Does This Have to Do With Golf?
Now let's apply this same framework to RST as a simple golf swing system. Just like the engine cooling system, the golf swing has five clearly defined areas:
- Setup
- Takeaway
- Back to Target
- Transition & Downswing
- Follow Through
You can use the same type of control chart to measure, assess, and visualize exactly where you stand in your golf swing development process.
You can return to your chart at any time to evaluate your progress and track your performance over weeks and months. For a data-driven assessment of how each component of your swing mechanics measures up, try a free AI swing analysis.

Defining the terms in the control chart; what does "Good" mean?
Let's establish some definitions. Green is "Good" — but what does that actually mean? "Good" exhibits all important elements of that swing phase.
You'll notice that the green space on our chart is relatively small, and that's by design. Reaching the level where all important elements are consistently in place is genuinely difficult.
If you tend toward perfectionism, remember that green doesn't mean flawless.
True perfection sits at the very top — the last row of green before you hit the black border. That represents the theoretical ceiling.
On the opposite end, the red Dysfunction space is also deliberately small.
Most golfers — especially dedicated RST students who are actively studying and working on their golf swing — won't find themselves in the dysfunctional category.
The two largest spaces on the chart are Functional and Deficient. Functional means you have most of the key elements and you execute them consistently.
You may not have perfected every single element, but your swing is functional enough to get around a golf course effectively. Deficient means your execution is inconsistent and you're still missing key elements.

Basic control chart
Dysfunctional, at the bottom, means the swing is essentially broken — few if any of the key swing attributes are present.
Using the Chart
We recommend creating your own version of this chart for your golf swing. It establishes a common language with your golf instructor, allowing you to ask specific questions like, "Am I in the green space with my setup? Where do I stand with my takeaway?"
If you revisit that conversation quarterly or monthly, meaningful trends will begin to emerge. To supplement your self-assessment with objective measurement, check out a free AI golf lesson that scores your swing mechanics in real time.
In this example, the student's backswing is progressing from white space toward green in Column 3, while their downswing and follow through are climbing out of yellow space toward white in Columns 4 and 5.
That's a realistic and encouraging chart. You can clearly see progress unfolding over time.
A golfer who is advancing from the earliest stages of learning the golf swing to being able to play confidently on the course can reference this chart alongside the instructor manual, where all the attributes of each swing element are documented.
Assign yourself an honest grade in each area, then revisit those grades over time to observe the trend. This systematic approach transforms vague feelings about your game into concrete, trackable improvement.
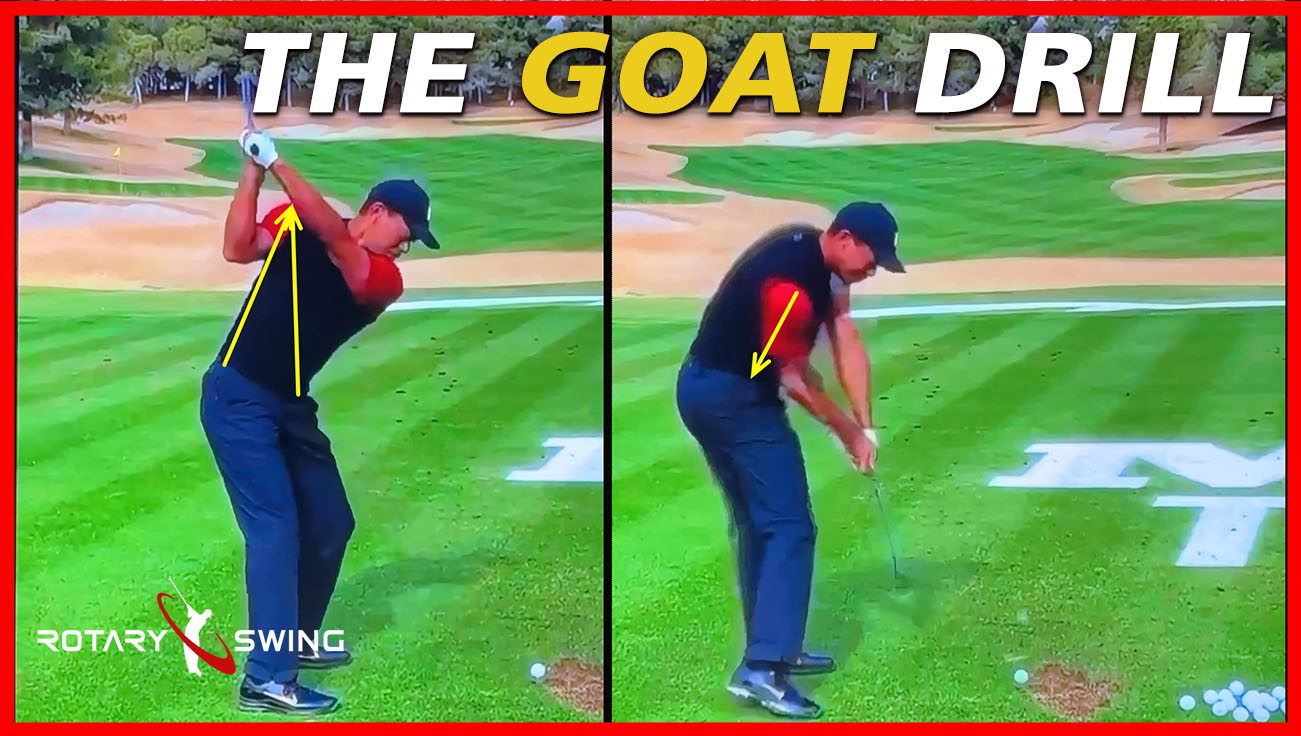
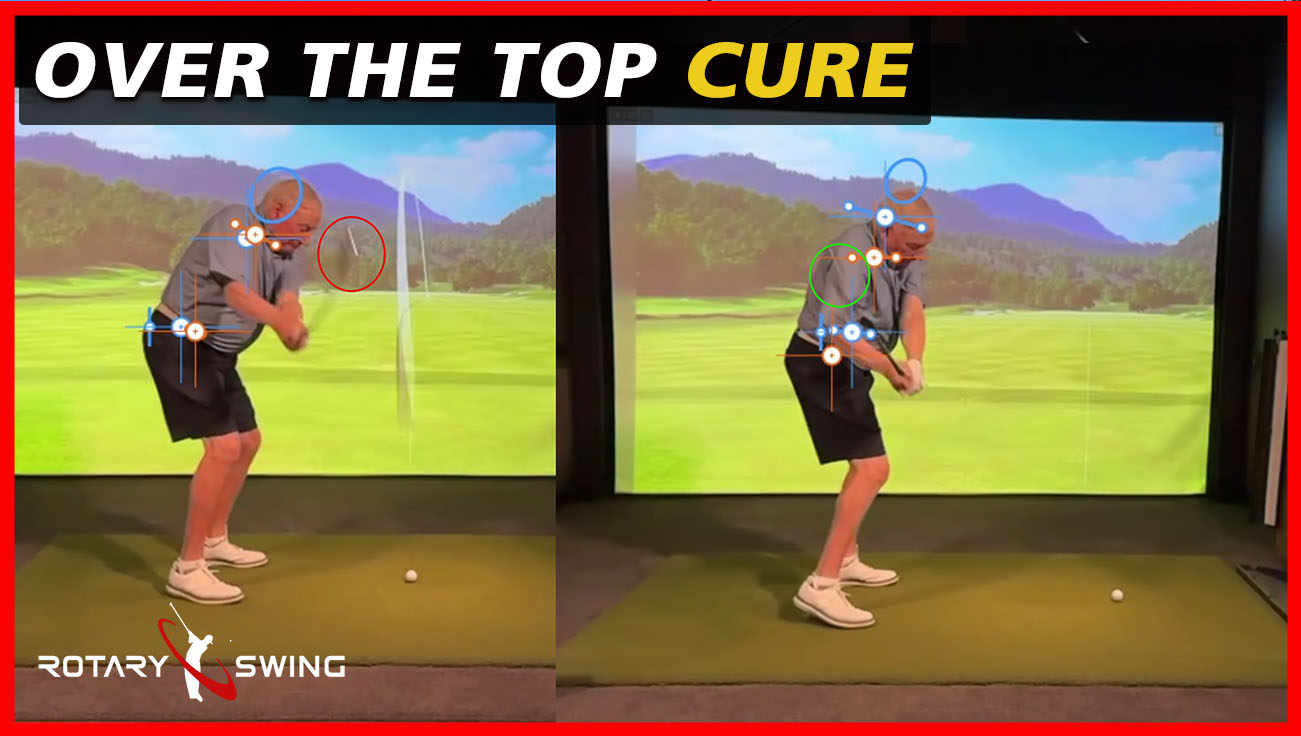
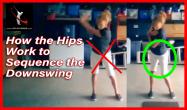
Watch part 2 now to see how you're moving your body in the opposite direction of the pros!